

Access the Activity Monitor
To open the Activity Monitor:- Go to your app editor.
- Click the More Actions icon () at the top right.
- Click Activity Monitor.
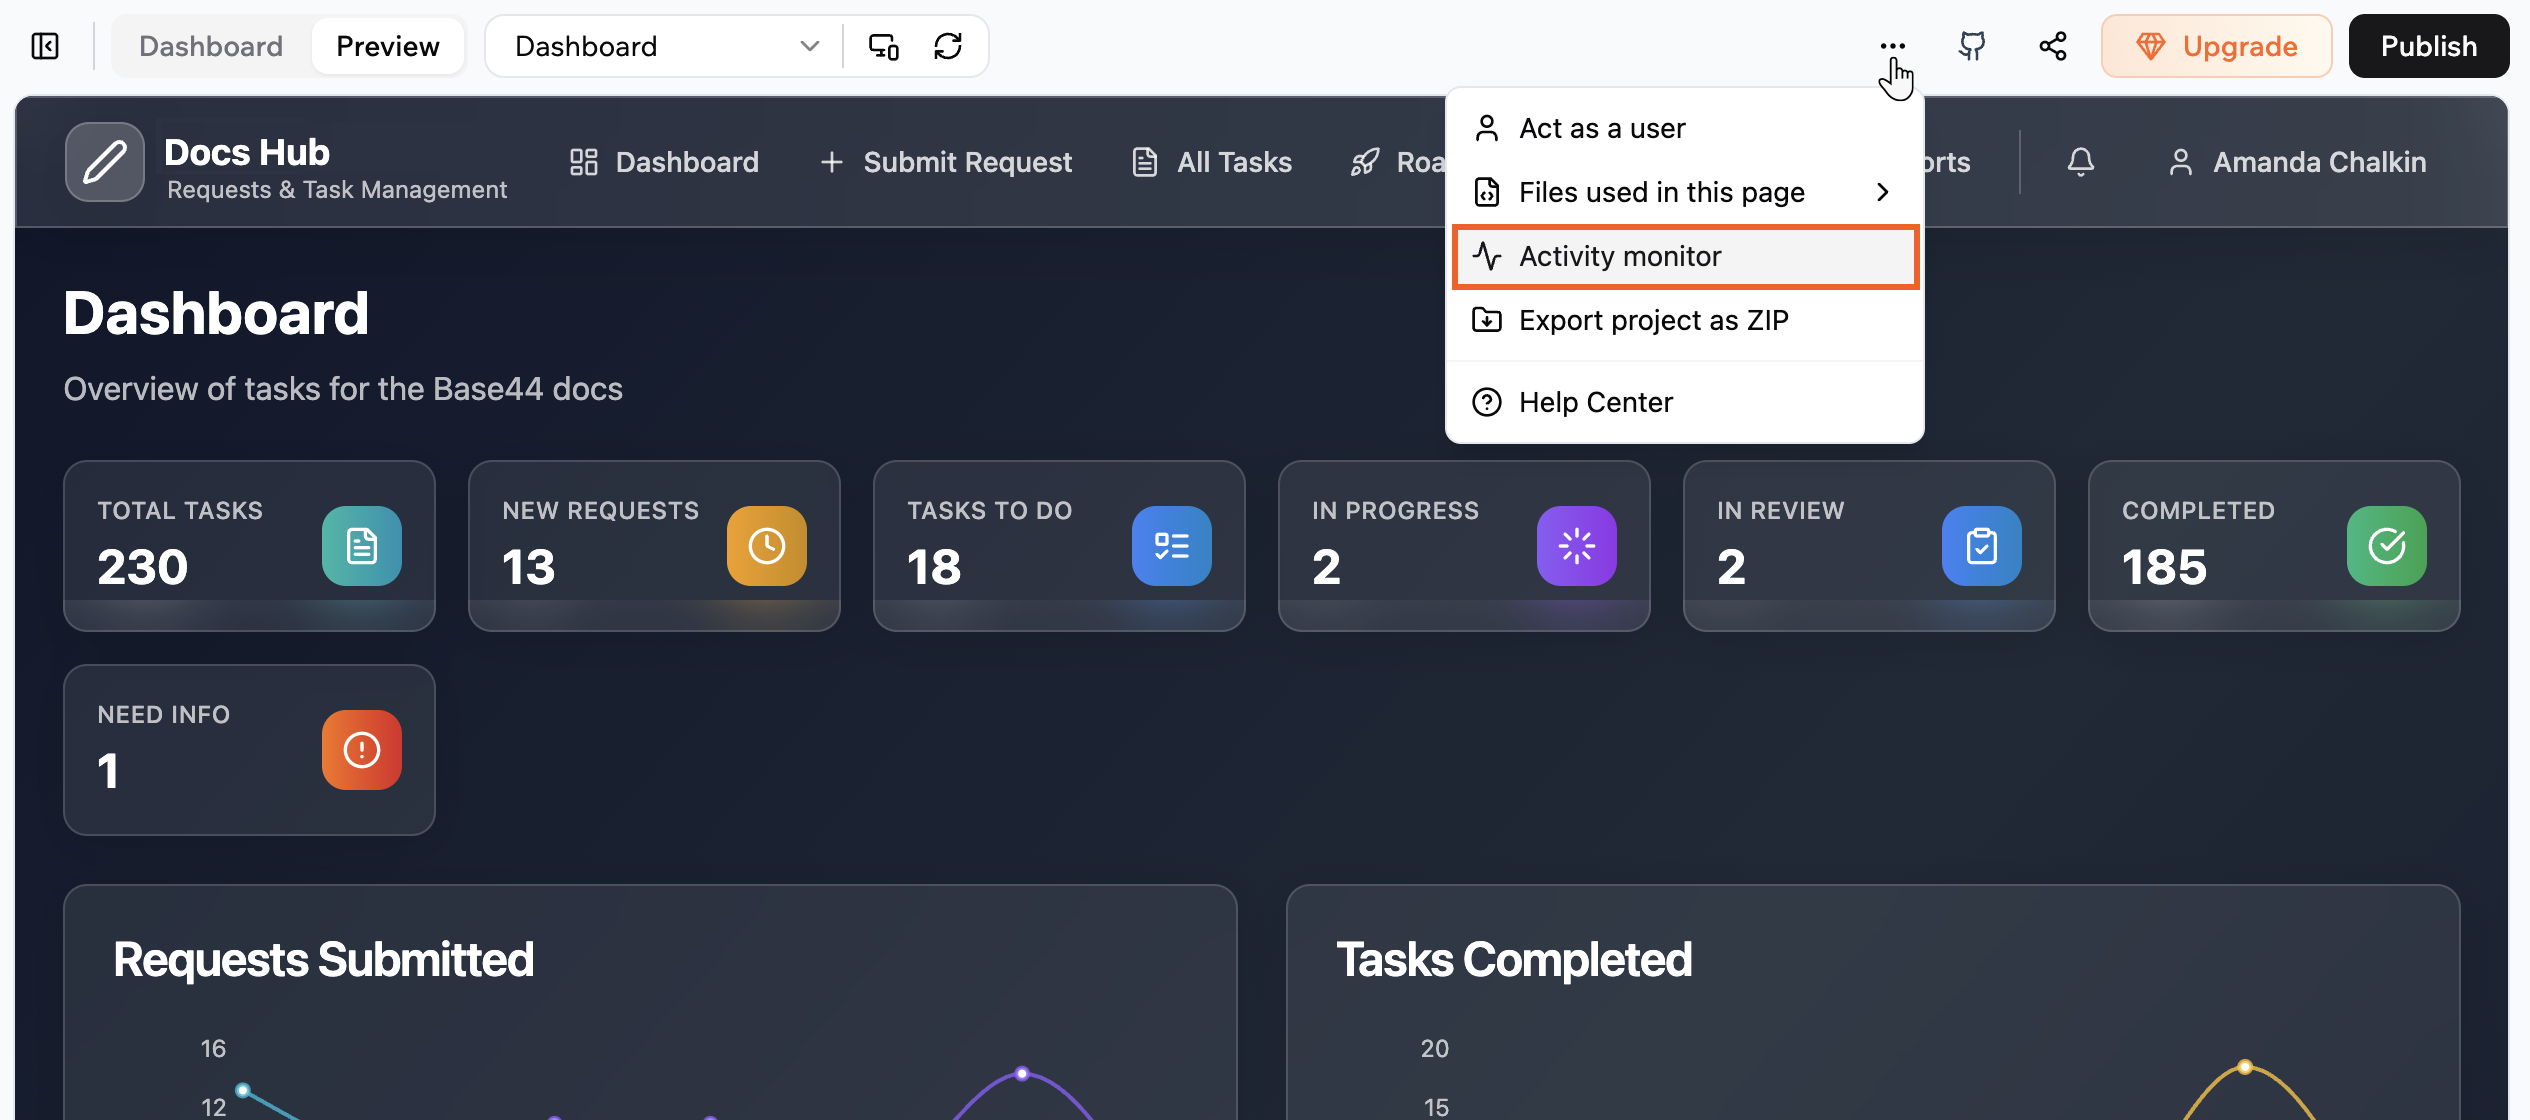
Access the Activity Monitor from the More Actions menu
Inspect a request
Click any entry in the list to see its details. The details panel has three tabs:- General: Full URL, HTTP method, status code, total time, and timestamps.
- Request: What your app sent, including headers, query parameters, and request body.
- Response: What the endpoint returned, including headers, body, or error message.

Inspect request details in the Activity Monitor