

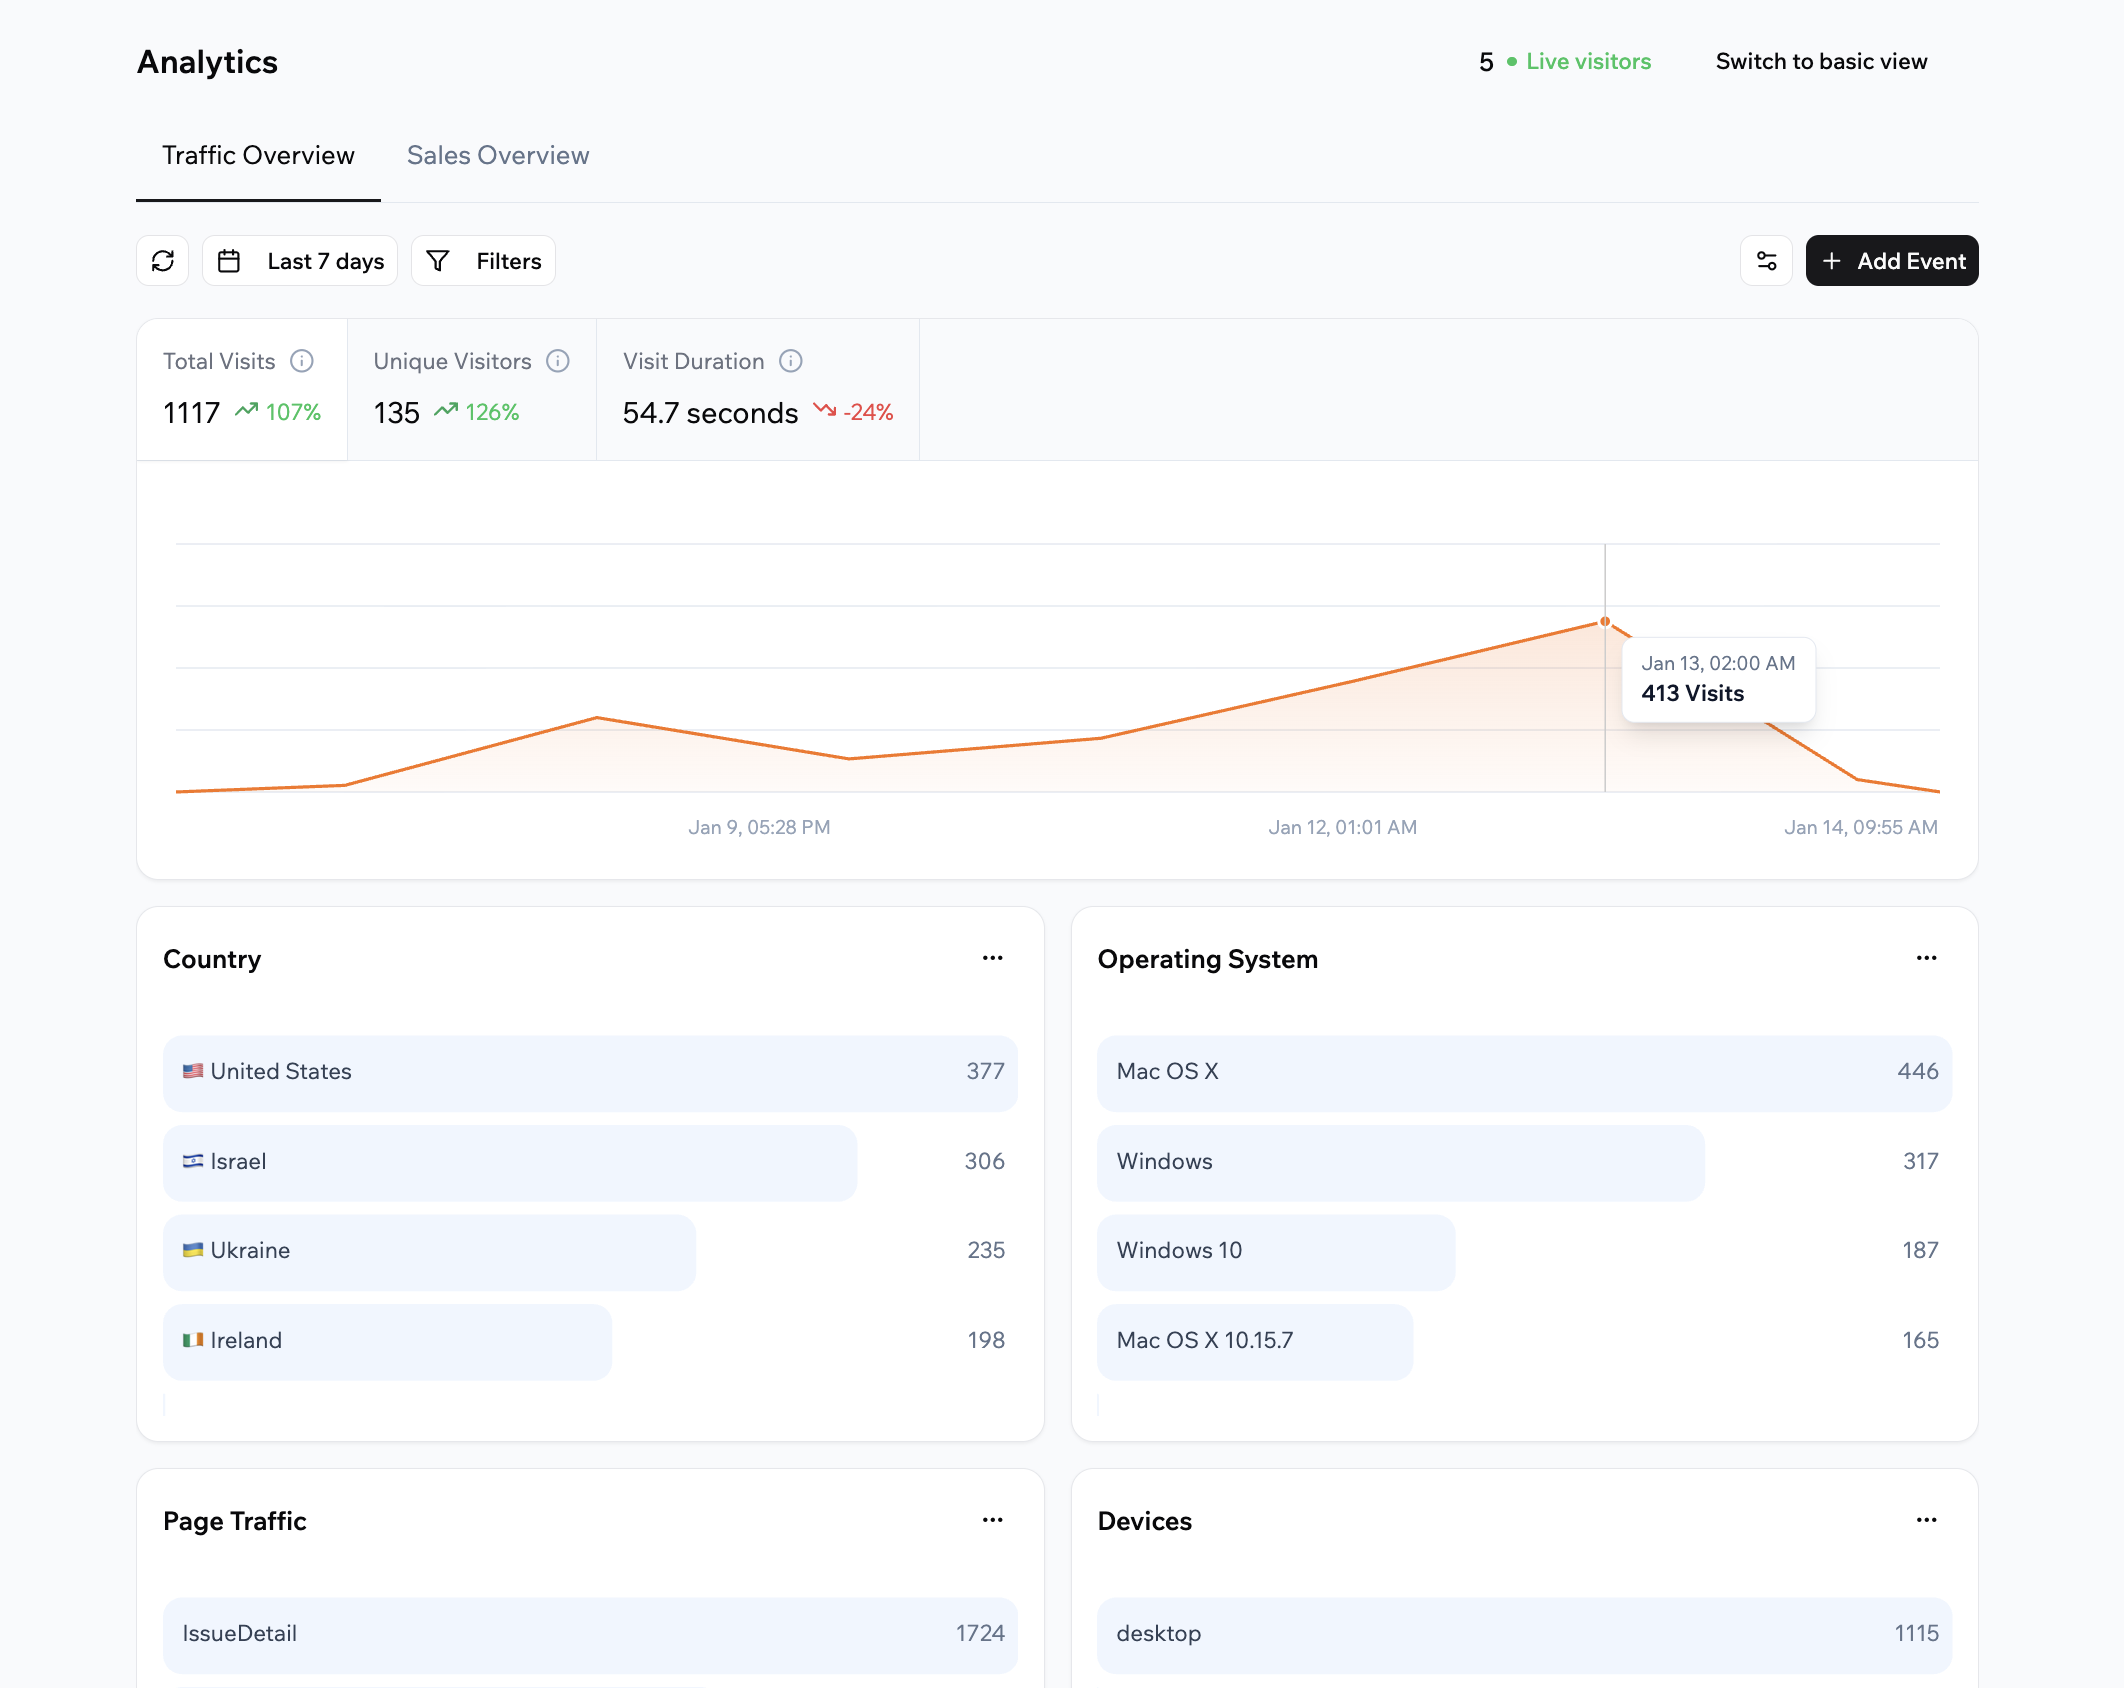
Viewing your Base44 app analytics in your dashboard
Accessing your analytics
Access your app’s analytics from your dashboard at any time to see how your app is performing.- Analytics starts collecting data after you publish your app and people begin visiting it. New or unpublished apps do not show analytics data.
- Analytics history is stored based on your Base44 plan:
- Free plan: Data is kept for 7 days.
- Starter plan and higher: Data is kept for 30 days.
- Enterprise plan: Data is kept for 365 days.
- Click Dashboard in your app editor.
- Click Analytics.
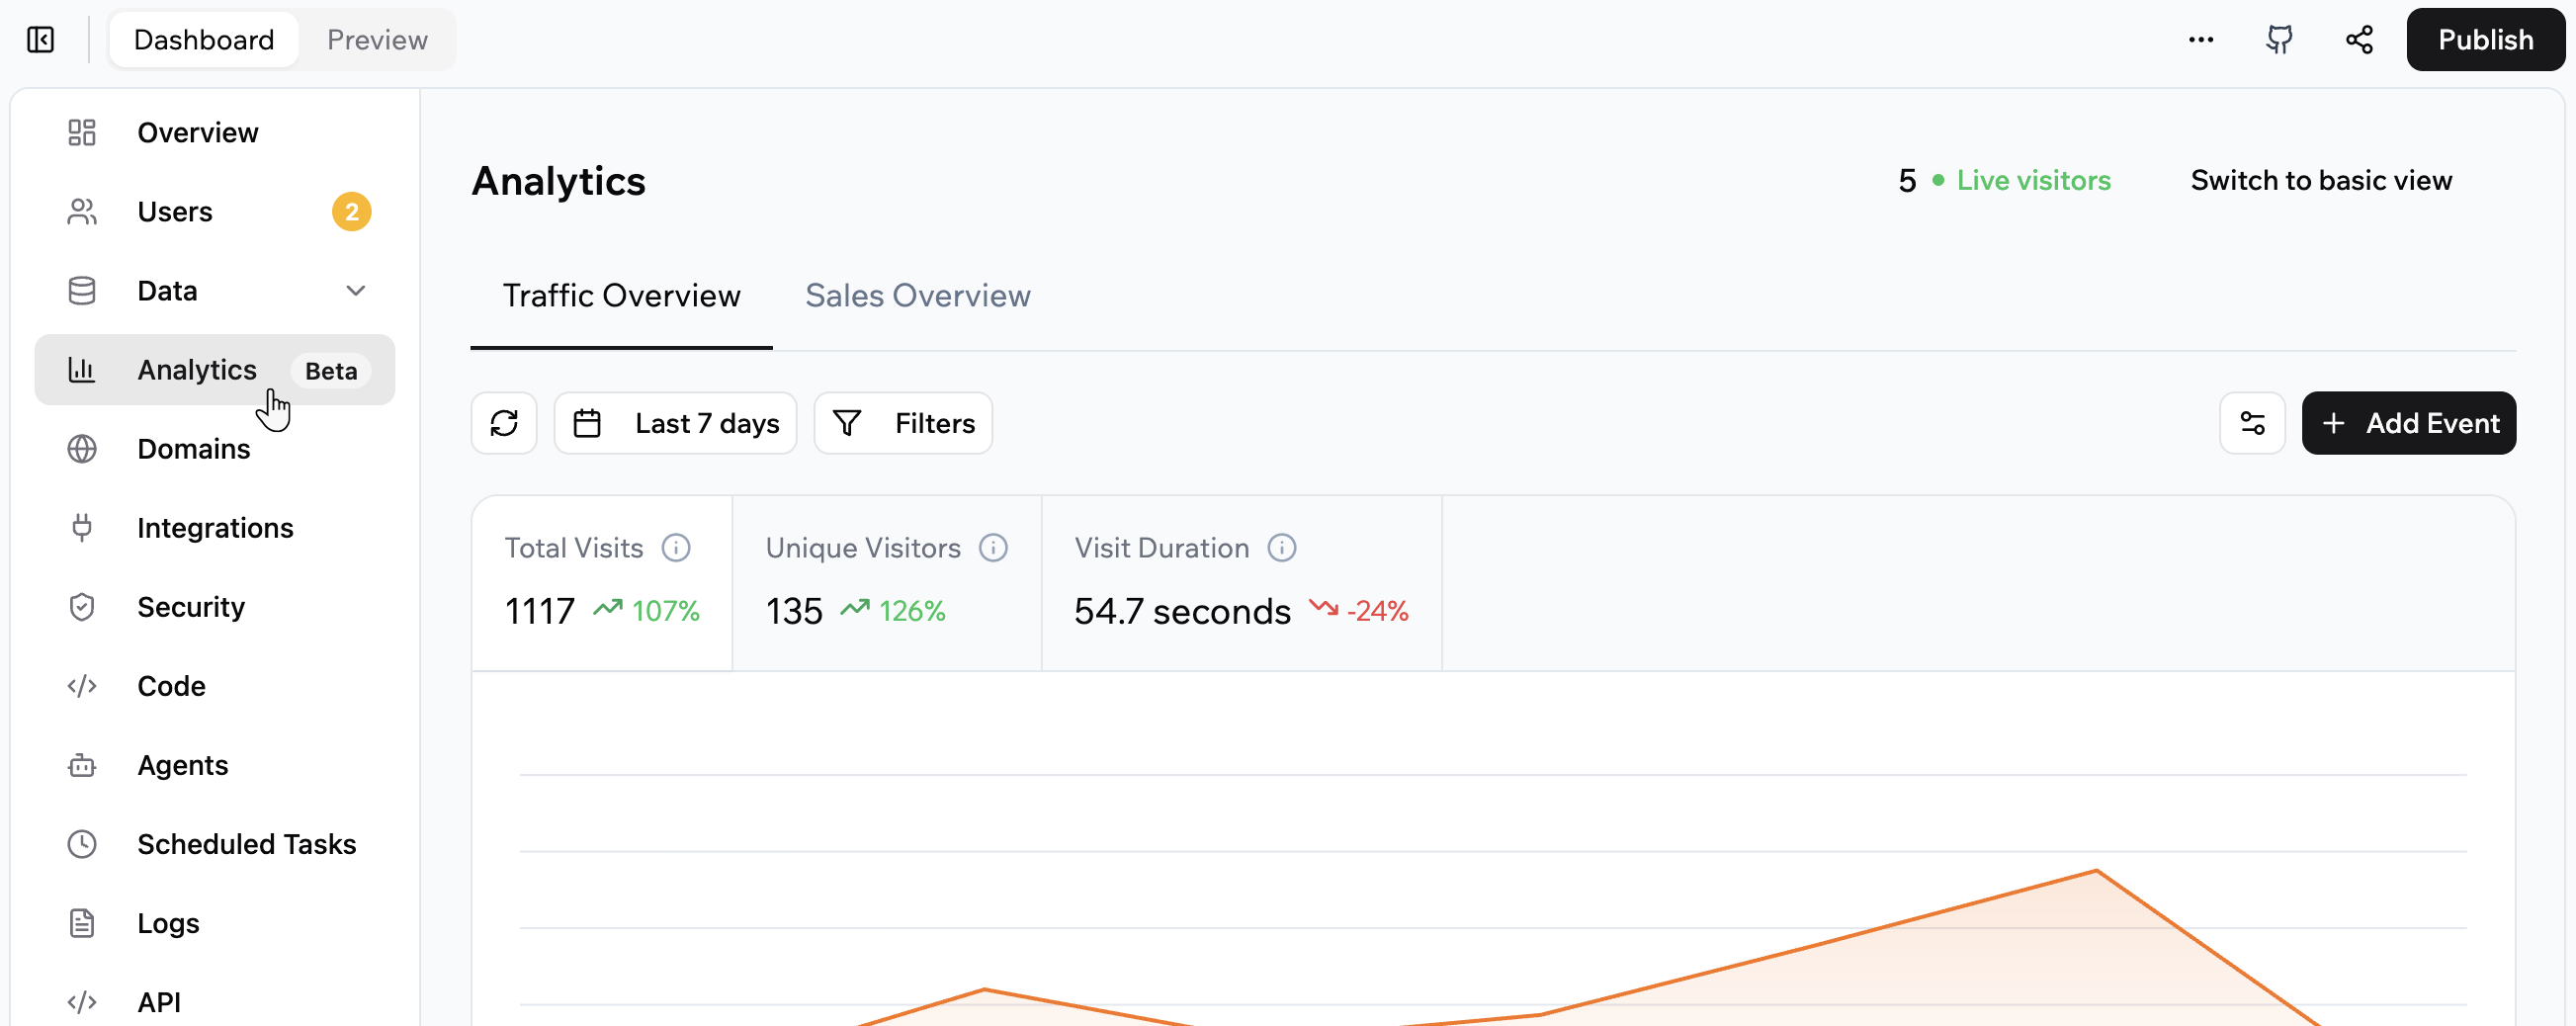
Accessing analytics for your Base44 app
Traffic overview
The Traffic Overview tab shows how people discover and use your app. It focuses on visits, visitors, and behavior.Understanding your traffic metrics
At the top of the Traffic Overview tab, you can see:- Total visits: All visits in the selected period, including repeat visits from the same visitor.
- Unique visitors: Each visitor counted once in the selected period, even if they visit multiple times.
- Visit duration: The average length of a visit during the selected time range.
- Live visitors: The number of people currently active in your app, updated in real time.
Customizing your dashboard
You can customize the layout of the Traffic Overview tab so it shows the cards that matter most to you. To customize your traffic dashboard:- Click Dashboard in your app editor.
- Click Analytics.
- Make sure Traffic Overview is selected.
- Click the Customize icon .
- Select the checkboxes for the cards you want to show.
- Drag the Reorder icon to change the order of the cards up or down in the list.
- Click Save.
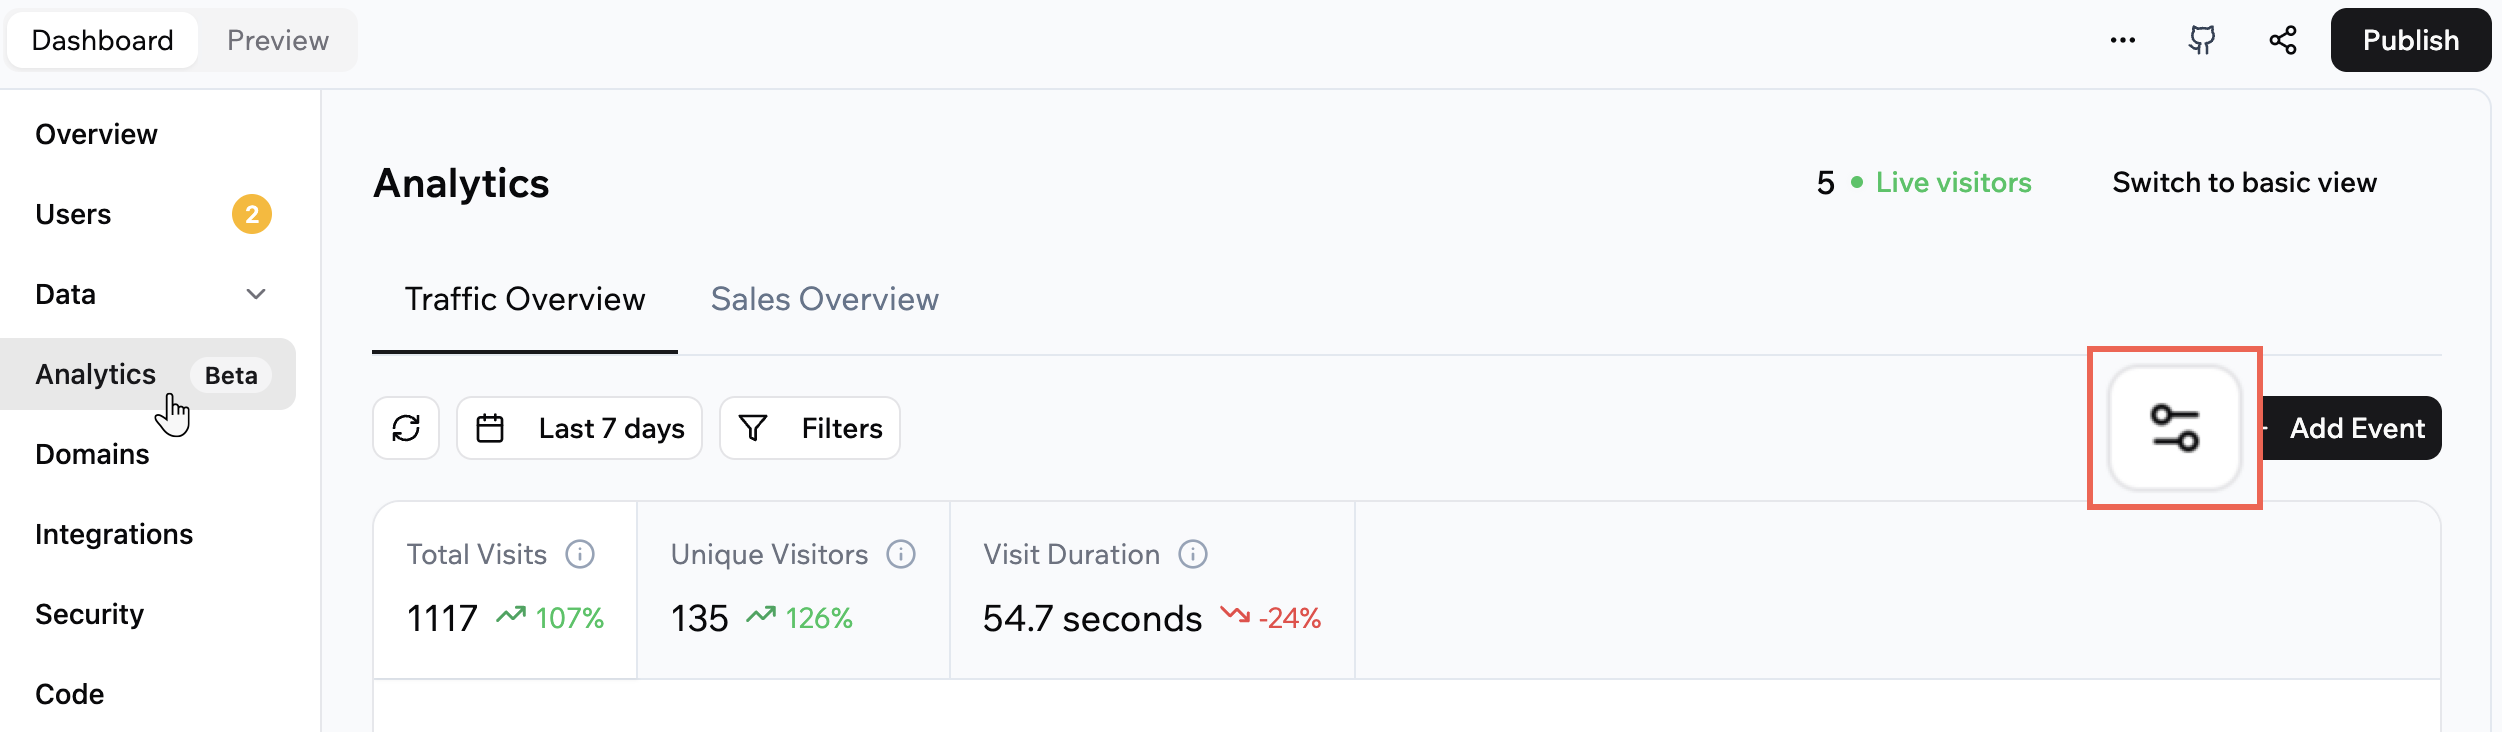
Customize the layout of your Analytics dashboard
Choosing the date range
Change the date range in Traffic Overview to focus on a specific period. To choose the date range for Traffic Overview:- Click Dashboard in your app editor.
- Click Analytics.
- Make sure Traffic Overview is selected.
- Click the Calendar icon at the top of the page.
- Select one of the presets or choose your own dates.
Filtering your data
Use filters in Traffic Overview to focus on specific segments, such as a particular page or country. To filter your traffic data:- Click Dashboard in your app editor.
- Click Analytics.
- Make sure Traffic Overview is selected.
- Click Filters and select what you want to see.
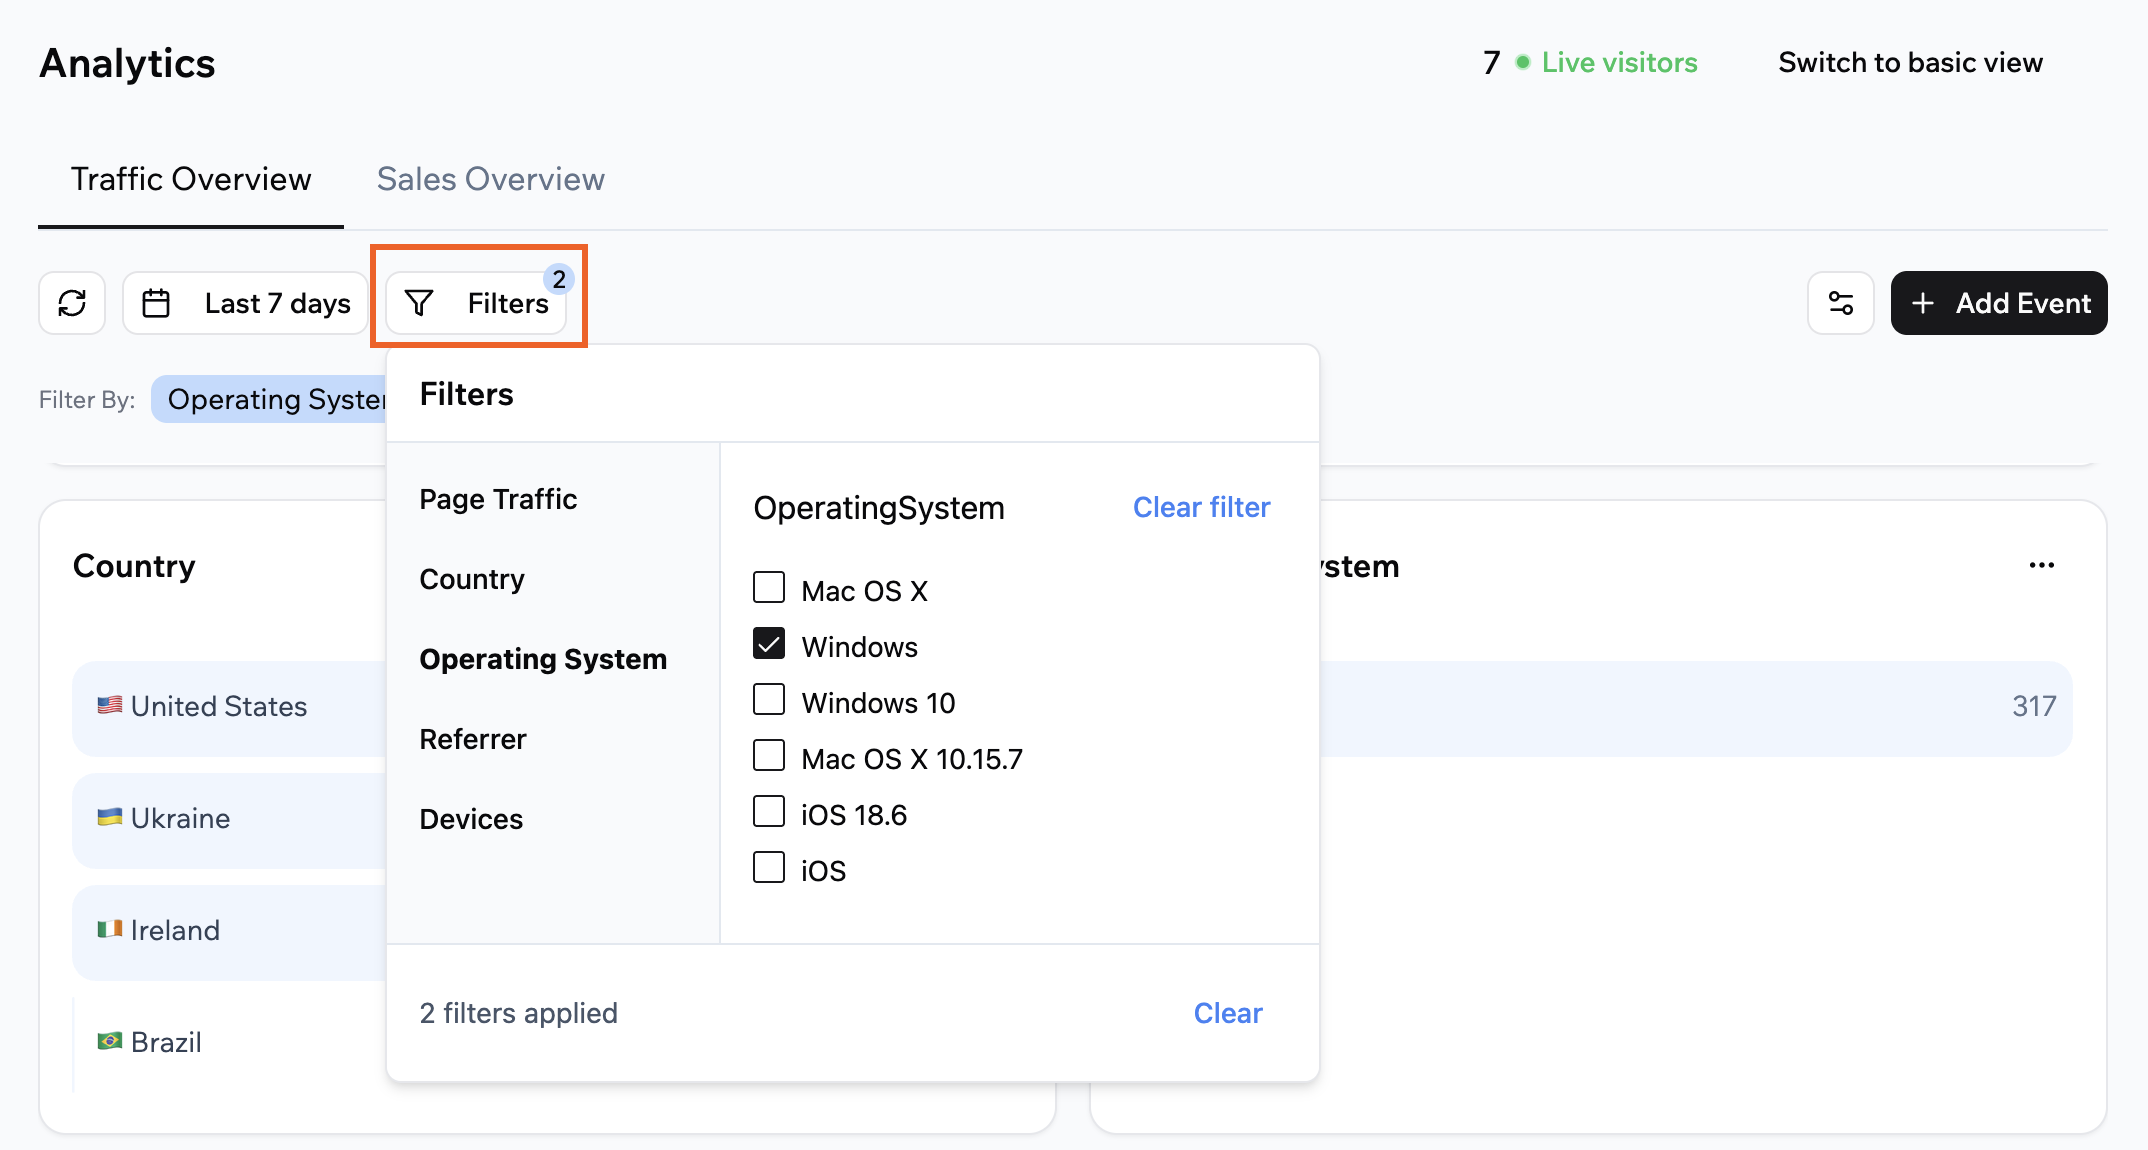
Filtering your data in the Analytics dashboard
Changing a chart type
Choose how each Traffic Overview card displays its data. To change a card’s chart type in Traffic Overview:- Click Dashboard in your app editor.
- Click Analytics.
- Make sure Traffic Overview is selected.
- Click the More Actions icon at the top right of the relevant card.
- Select a chart type.
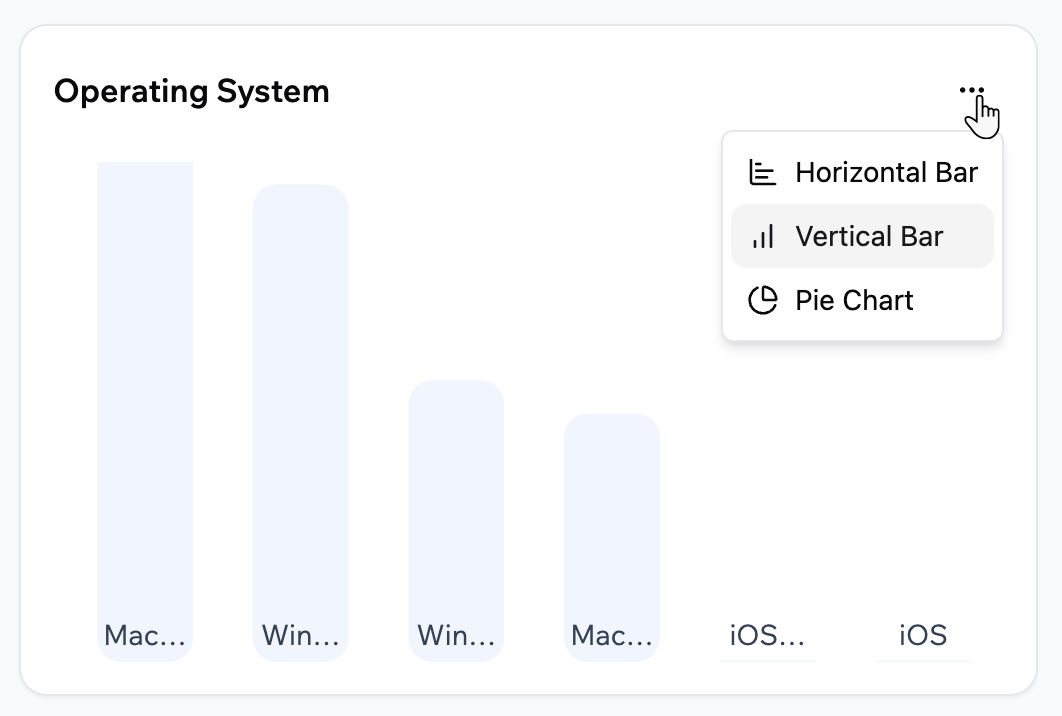
Changing the chart type of a card in your Analytics dashboard
Sales overview
The Sales Overview tab shows payment metrics for payments processed through Stripe. It focuses on completed payments rather than visits.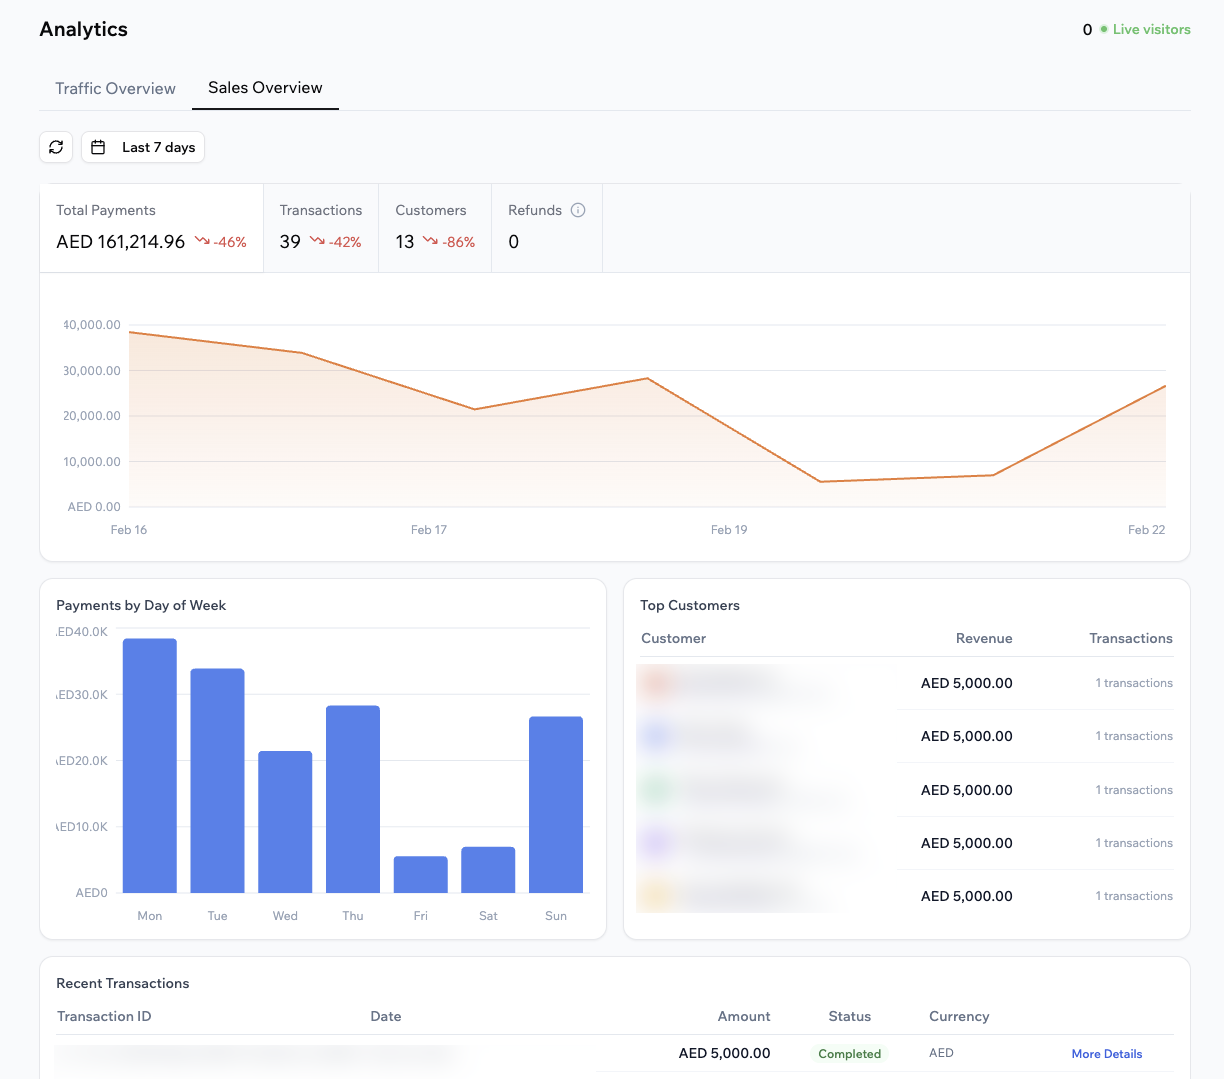
Viewing your sales analytics for your app
Understanding your sales metrics
At the top of the Sales Overview tab, you can see:- Total payments: The total processed payment amount in the selected period.
- Transactions: The number of successful payment transactions.
- Customers: The number of unique customers who completed at least one payment.
- Refunds: The total refunded amount in the selected period.
- Payments by day of week (avg): A chart that shows your average payments for each day of the week in the selected period.
- Top customers: A list of customers with the highest total payments, including customer name, revenue, and number of transactions.
- Recent transactions: A table of your latest payments, including transaction ID, amount, status, currency, and a link to more details.
- The Sales Overview currently shows payments processed through Stripe only. Support for additional providers, such as Wix Payments, will be added in the future.
- If you process payments in more than one currency, you can view the dashboard per currency using the currency drop-down at the top of the tab.
Choosing the date range
Change the date range in Sales Overview to focus on a specific sales period. To choose the date range for Sales Overview:- Click Dashboard in your app editor.
- Click Analytics.
- Click Sales Overview.
- Click the Calendar icon at the top of the page.
- Select one of the presets or choose your own dates.
Tracking custom events
Custom events let you track specific actions people take in your app, such as button clicks, sign-ups, or form submissions. Base44 uses AI to help you define these events and wire them into your app so they appear as cards in the Traffic Overview tab. They do not appear in Sales Overview. Each custom event card shows:- The name of your event, for example “Shop Now” button clicks.
- A total count for the selected time range, such as Total clicks.
- A chart that shows how the event changes over time.
Creating a custom event
Describe the event you want to track in the AI chat, or choose from the AI suggested events. To create a custom event:- Click Dashboard in your app editor.
- Click Analytics.
- Make sure Traffic Overview is selected.
- Click + Add Event.
- Click one of the suggested prompts or describe the action you want to track in the AI chat in your own words. For example:
- “Track clicks on the Sign Up button.”
- “Track when someone submits the contact form.”
- “Track how many people view the Pricing page.”
- Review the event description that appears in your Base44 AI chat on the left and send the prompt to the chat.
- Publish your app so the new event is live.
Viewing event details
You must first publish your app to see event details for your custom events. Events in preview are not counted towards the analytics data. To view event details for a custom event:- Click Dashboard in your app editor.
- Click Analytics.
- Make sure Traffic Overview is selected.
- Click the More Actions icon at the top right of the custom event card.
- Click Event details.
- Click Export CSV to download the data.
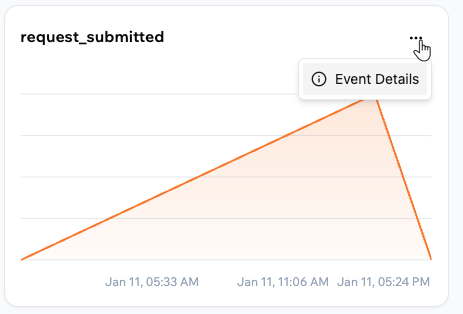
Viewing event details for your custom event in your app analytics
Turning off analytics
Analytics is on by default, and nothing changes for an app unless you ask. To stop it, ask the AI chat to turn analytics off. You turn it off one app at a time, and it takes effect once that app is rebuilt and republished. You can do this for any app or browser game, however long ago you built it. Native mobile apps never collect it, so there is nothing to turn off. Turning it off is not the same as an empty dashboard. Some data reaches analytics another way and keeps arriving.- Open your app in the app editor.
- In the AI chat, ask to turn off analytics for the app.
- Review and approve the change.
- Publish your app.
FAQs
Click a question below to learn more about app analytics in Base44.Why might my analytics numbers look different from other analytics tools?
Why might my analytics numbers look different from other analytics tools?
How can I keep analytics data longer than my plan’s retention period?
How can I keep analytics data longer than my plan’s retention period?
Who can see my app analytics?
Who can see my app analytics?
How can I tell if a custom event is working correctly?
How can I tell if a custom event is working correctly?
Can I turn analytics back on after turning it off?
Can I turn analytics back on after turning it off?
Can I reset my analytics and start from zero?
Can I reset my analytics and start from zero?
How should I use both unique visitors and total visits together?
How should I use both unique visitors and total visits together?
What can I do if the numbers look lower than I expect?
What can I do if the numbers look lower than I expect?
How can analytics help me after I release a new feature?
How can analytics help me after I release a new feature?