

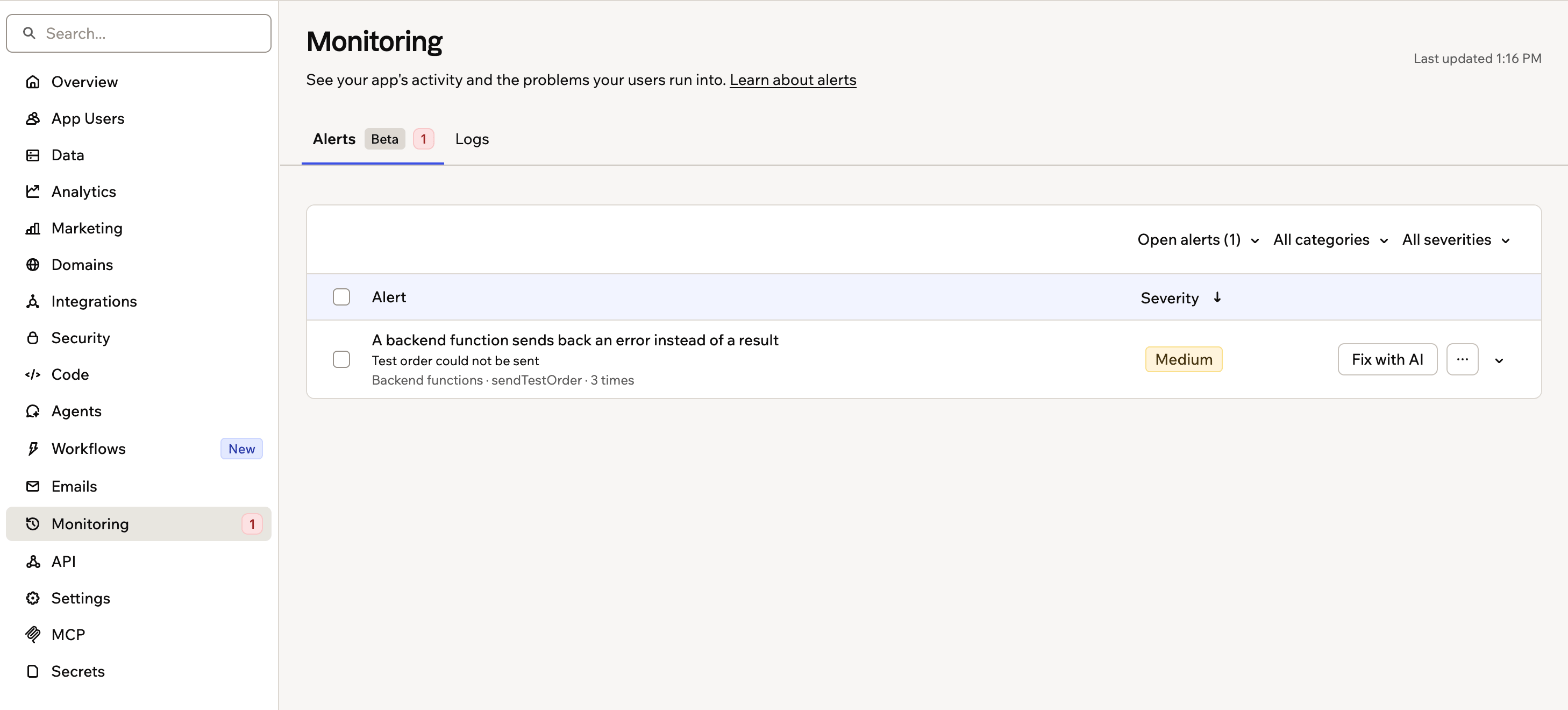
Open alerts on the Monitoring page
Finding alerts and logs
Your alerts and logs are in your app dashboard.Due to recent updates, this page might be called Monitoring or Logs in your dashboard sidebar.
- Go to your app editor.
- Click Dashboard.
- Click Monitoring or Logs in the sidebar.
- If you see the Alerts and Logs tabs, click the one you want.
Using production alerts
Production alerts watch your published app for problems your app users run into, such as records that fail to save, backend functions or server code that return errors, or integrations that fail. Turn on alerts for your app, then review and fix what they find.Turning alerts on or off
Alerts are off until you turn them on, and you turn them on for each app separately. Once they’re on, Base44 starts watching your published app and lists problems on the Alerts tab. To turn on production alerts:- Go to your app editor.
- Click Dashboard.
- Click Monitoring in the sidebar.
- Click Turn on alerts on the Alerts tab.
- Click Turn on to confirm.
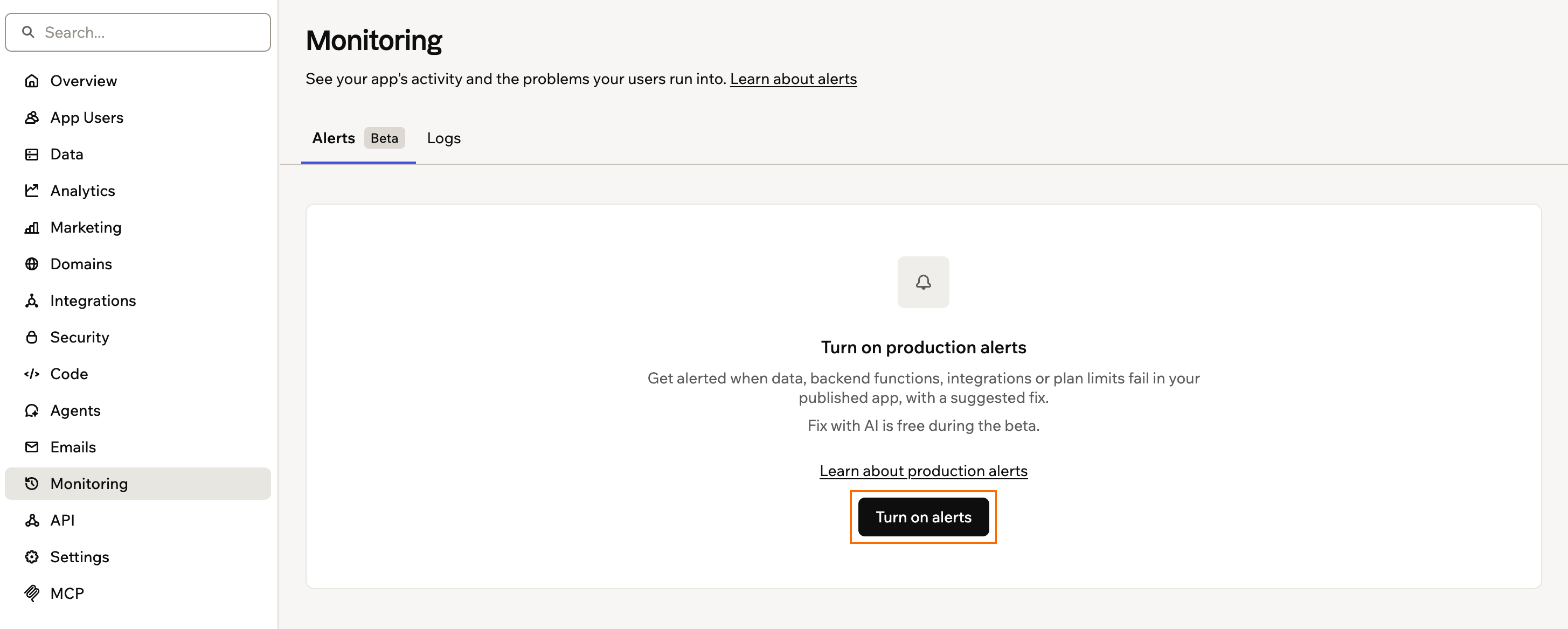
Turning on alerts from the Alerts tab
- Go to your app editor.
- Click Dashboard.
- Click Settings.
- Turn off the Production alerts toggle.
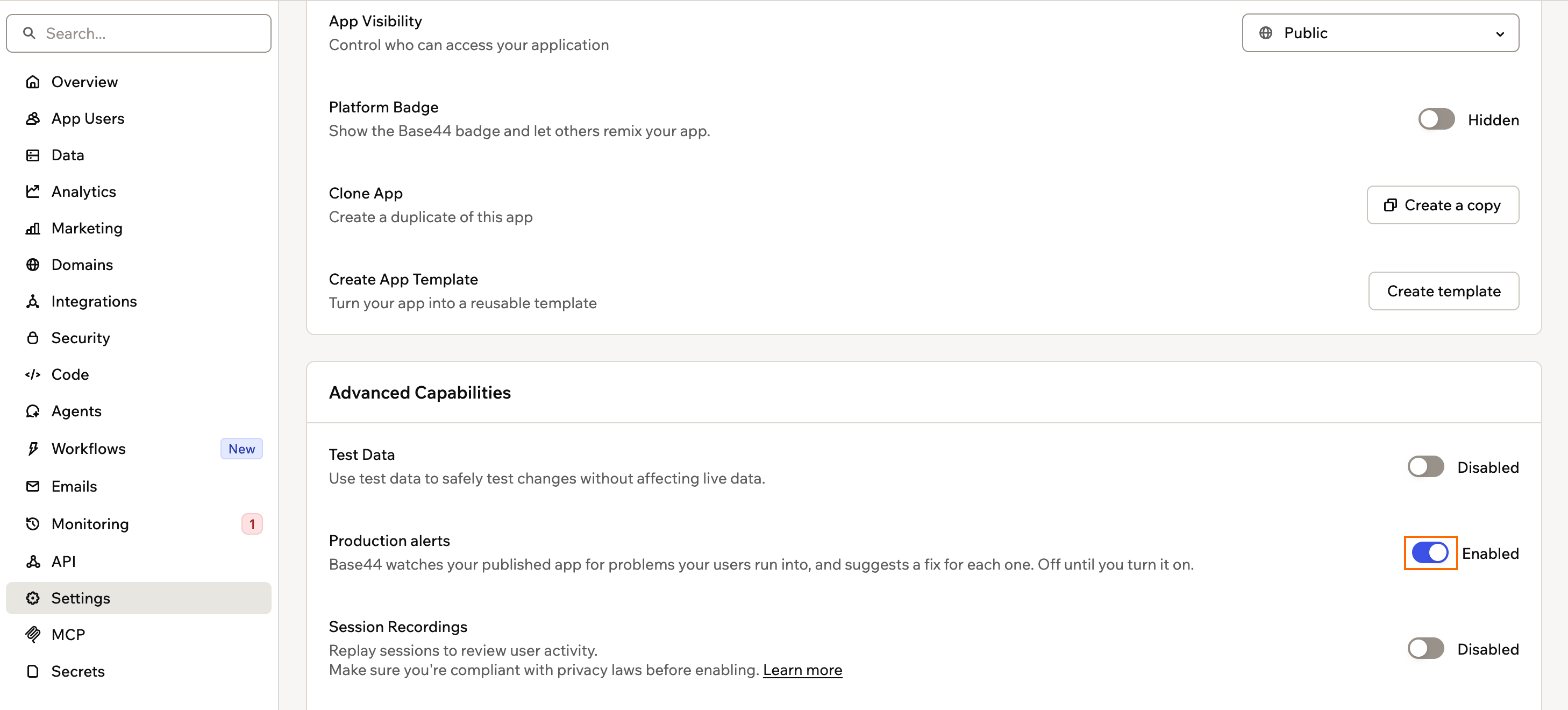
Turning off alerts in your app settings
Reviewing alerts
Each alert shows how serious the problem is and what kind of problem it is, such as a data, backend function, server, or integration problem. The number next to Monitoring in the sidebar shows how many alerts are open. New problems can take a few minutes to appear. Alerts are sorted into 3 views:- Open: Problems that need your attention.
- Fixed: Alerts you fixed, and problems that stopped on their own.
- Dismissed: Alerts you chose not to act on.
- Go to your app editor.
- Click Dashboard.
- Click Monitoring in the sidebar.
- Click the Alerts tab.
- (Optional) Choose Open, Fixed or Dismissed from the view menu, and use the category and severity filters to narrow the list.
- Click an alert to see its details. You see what happened, how many times it happened and, when it’s known, how many people it affected. Click More details to see the error, the page it came from, and when it was first and last seen.
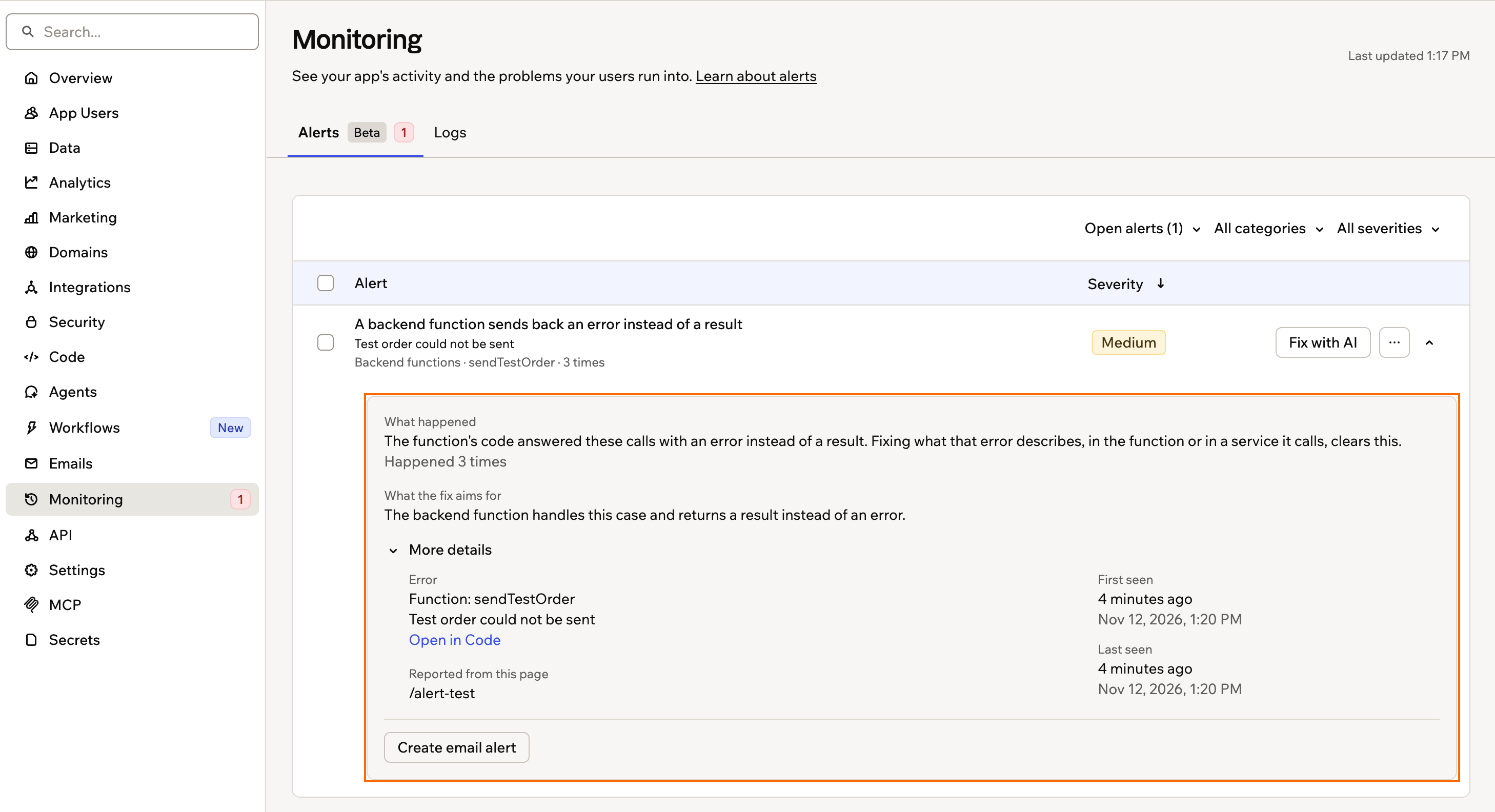
An alert's details
Fixing alerts
Each alert shows the best way to fix it. For problems in your app, the AI can work on a fix for you. For problems with your plan or setup, the alert offers a quick fix instead, such as upgrading your plan, adding credits, or verifying your domain. The AI explains what’s wrong and suggests a fix for you to approve. Your fix reaches your app users only after you publish. Once it’s live, the alert moves to Fixed. If the problem comes back, the alert reopens. If you leave your code as it is, the alert shows No changes made. To try again, click Try again in the alert’s row.Fixing an alert with Fix with AI doesn’t use your credits.
- Go to your app editor.
- Click Dashboard.
- Click Monitoring in the sidebar.
- On the Alerts tab, do one of the following:
- Fix one alert: Click Fix with AI in the alert’s row.
- Fix up to 10 alerts at once: Select the alerts, click Fix [number] selected, then click Fix with AI to confirm.
- In the AI chat, read the explanation, then choose the option to apply the fix. You can also type a reply to change the fix or leave your code as it is.
- Go back to Monitoring in your app dashboard.
- Click Publish in the banner above the list of alerts.
Getting email alerts
Create an email alert to hear about a problem the next time it happens, without checking the Alerts tab. The first time the problem happens again, you get an email and a Base44 notification. After that, you hear about it at most once a day while it keeps happening. Your email alert can take a moment to set up. Once it’s ready, the alert shows Email alert on. To edit or stop the email alert, click the alert on the Alerts tab, or go to the Workflows page. You can’t create an email alert for a dismissed alert or for an alert about your plan or credits. To create an email alert:- Go to your app editor.
- Click Dashboard.
- Click Monitoring in the sidebar.
- Click the alert on the Alerts tab to see its details.
- Click Create email alert.
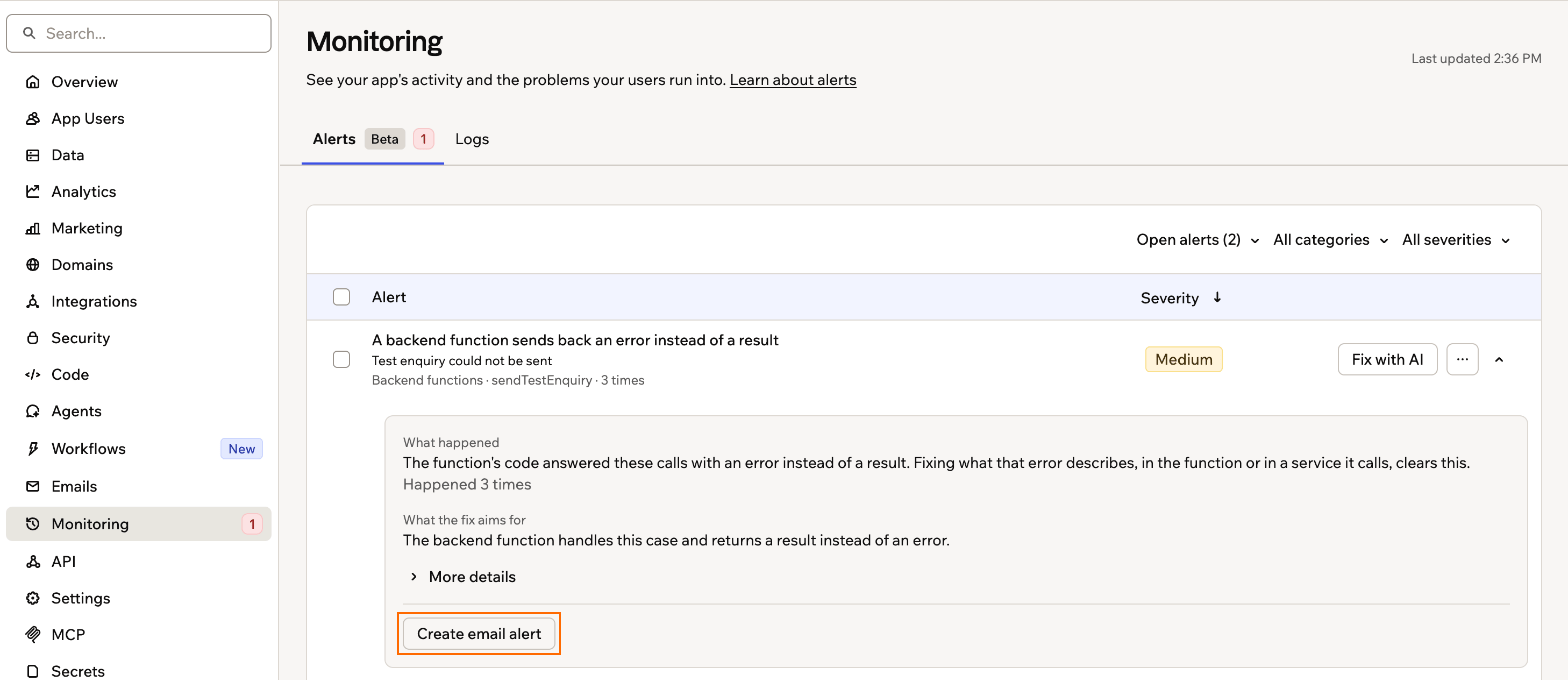
Creating an email alert from an alert's details
Dismissing alerts
Dismiss an alert you don’t plan to act on, and it moves out of your open alerts. A dismissed alert stays dismissed even if the problem happens again, until you restore it. To dismiss an alert:- Go to your app editor.
- Click Dashboard.
- Click Monitoring in the sidebar.
-
Click the More actions icon next to the alert on the Alerts tab.
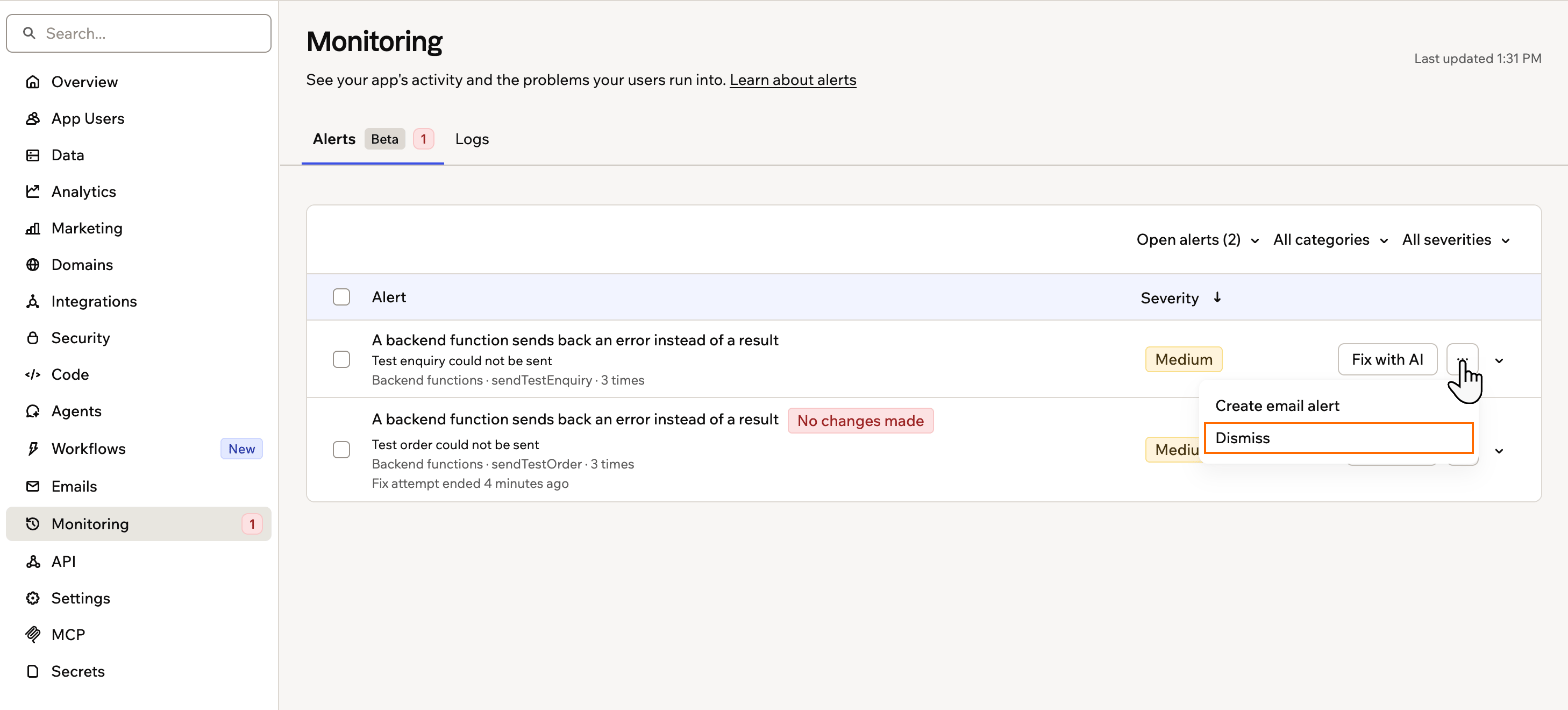
Dismissing an alert from its More actions menu
- Click Dismiss.
Exploring logs
Use logs to troubleshoot problems, confirm that automations ran, and review who did what in your app, from user actions and function calls to schema and integration changes. Each event shows its type, who did it, and when, and you can expand any event to see its full details.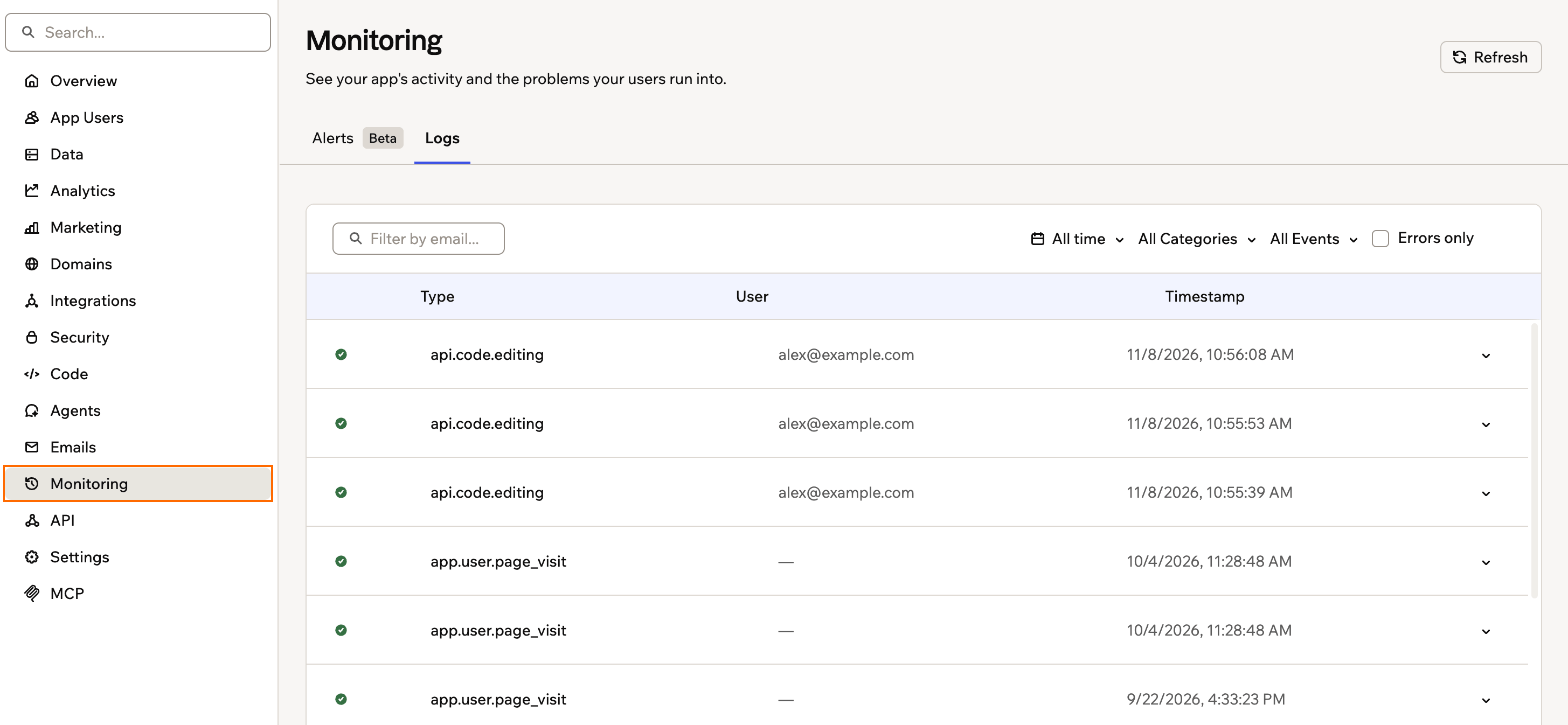
Your app logs
Understanding log categories
Logs are grouped into 2 categories.- Runtime: Activity that happens while people use your app. This includes entity operations (created, updated, deleted, restored), user events (registered, login, invited, role changed, page visits), access requests, function calls, integration and automation executions, agent conversations, data imports, file uploads, and security checks.
- Setup: Changes to how your app is built and configured. This includes app lifecycle events (created, published, unpublished), entity schema changes, payment and OAuth integration setup, and domain changes.
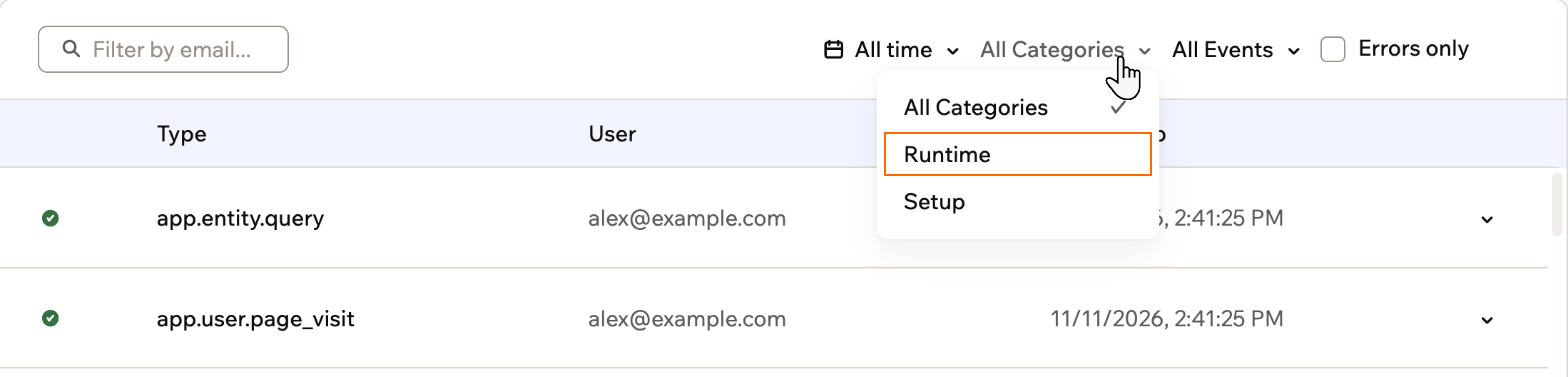
Filtering logs by category
Filtering logs
Use the controls above the table to focus on the events you care about.- All time drop-down: Show events from a time range, from the last 15 minutes to the last 30 days, or choose Custom range to pick your own dates.
- All Events drop-down: Filter by a specific event type, such as Entity Updated or Function Call.
- Filter by email: Enter an email address to see one person’s activity.
- Errors only: Turn this on to show only failed events.

Filtering your logs
Viewing event details
Click a log row to expand it. Depending on the event, the expanded row shows:- Details: The full metadata of the event, such as the entity and fields involved.
- Outputs: What the event produced, for example a function’s response.
- Error: The error message, when the event failed.

Inspecting the details of a log event
FAQs
Click a question below to learn more about monitoring your app.Why don't I see any logs?
Why don't I see any logs?
Logs appear once there is activity in your app. If the table stays empty, open your app, perform an action such as creating a record, then click Refresh.
Are logs the same as analytics?
Are logs the same as analytics?
No. Analytics summarizes traffic and usage trends, while logs record individual events with full details. Use analytics to understand how your app performs and logs to investigate specific actions.
Can I see logs for my backend functions?
Can I see logs for my backend functions?
Yes. Filter the event type to Function Call to see each invocation. For live debugging while you build, you can also use the activity monitor in the code editor.